Skip to content

Category: Infra-as-code

Tutorial – What is Infrastructure as Code?

Howdy!! There’s so much network automation content out there, I’ve been feeling like there’s not much value in blogging about it. This is the first post of a of a series with some theory and lab-like tutorials plus code examples of what I believe to be the meat and bones of Infrastructure as Code(IaC).

In the last decade, the industry has been seeing a strong push to adopt software practices towards network engineering. SOME COMPANIES have been successful at that, but I don’t think that’s for everyone. Software development is hard; cost-effective software development is an especially rare beast when you are paying 300K per engineer annually. Okay, so, what?

I claim it’s way more feasible to take a shorter step and aim to implement successful DevOps practices to your networking team than it is to FULLY run your network team like a software team. Infra-as-Code comes in as an enabler for that goal.

Why Infra-as-Code(IaC)?

Infrastructure as Code can simplify and accelerate your infrastructure provisioning process, help you avoid mistakes and comply with policies, keep your environments consistent, and save your company a lot of time and money. Your engineers can be more productive on focus on higher-value tasks. And you can better serve your customers.

https://www.thorntech.com/2018/01/infrastructureascodebenefits/

If IaC isn’t something you’re doing now, maybe it’s time to start!

I’m SOLD! HOW can I get started?

I’m glad I asked! This article defines 6 best-practices to take the most out of IaC:

  1. Codify everything
  2. Document as little as possible
  3. Maintain version control
  4. Continuously test, integrate, and deploy
  5. Make your infrastructure code modular
  6. Make your infrastructure immutable (when possible)

So, this is our lab curriculum, so far:
1. Codify everything: How to use Ansible to automate network provisioning.
3. Maintain version control: Git Tutorial with Ansible
4. Continuously test, integrate and deploy: CI/CD with GitLab
4.1 Continuous test with Batfish and Robot framework

Let me know how this sounds, and if you find this post in the future but I haven’t followed up with it, please make a comment, and I’ll do my best to get it done.

Leave a Comment

Test-driven Network Automation

It’s been a while. In my last post, I narrated my experience at the NANOG 72 hackathon where I started working on a canarying project. I’m going to dive deeper into the underlying concepts for Test-driven Network Automation.

Why?

Justifiably there’s currently a big push for Infra-as-Code (IAC) in networking. IAC is pursued in order to enable modern software processes on infrastructure. The main benefits we are looking for is agility and predictability. Agility meaning faster feature delivery cycles. Predictability meaning reduction of outages: by automating deployment we can reduce human mistakes during maintenance. By doing so, you enable your team to collaborate more effectively and compound their productivity gains by improving code, ultimately allowing you to run a huge network with a small team.

As a side note, I believe those efficiencies developed in webscale companies like Facebook, Google, Microsoft will be assimilated into the markets sooner or later. Current network operation teams in TELCOs ( Verizon, AT&T, Comcast, Charter ) are orders of magnitude bigger than Webscale’s teams. So, ultimately I believe OpEx will slowly push inefficient practices out of the markets.

How?

CI/CD is fairly well-defined as a software practice. The question is how do we apply it to network automation. The following is a good representation of the process, supplied by Juniper( I think ):

  1. Make changes
  2. Pull Request
  3. Peer-review – Automation code is reviewed
  4. Dry-run – Dry-run against a lab or production
  5. Notify results – Config Diffs, Errors?
  6. Approve
  7. Canary changes until the whole system is upgraded or rollback changes

Now, that’s a fair process, The missing part here is test automation. Augmenting this process with test automation allows bugs to be found faster, reducing outages. The networking tests can be basically summarized into 5 categories.

  • Config checks ( format )
  • State check ( ARP table entries, Routing table, BGP neighbors )
  • L2 reachability health
  • L3 connectivity health
  • Application health

I discuss some of this tests later in this article. Now the remaining thing is to do the canarying properly. Thus I’d augment the deployment phase:

  1. Record baseline health-state
  2. Deploy changes to a subset of nodes
  3. Wait/Gather data
  4. Observe alarms
    • After quarantine wait-time has passed, increment change subset and go back to step 2.
    • If alarms are unacceptable, rollback change

In this way, you guarantee that only a subset of your network is affected by possible errors.

Ultimately, Application health data should drive this. But usually, that data is nor easily consumable because team silos, or it’s simply difficult to get a small set of application-level metrics that deterministically tell the network has a problem. So, we revert back to L3 connectivity. Now, speaking of L3 connectivity we basically mean latency, loss, and throughput. The only way to get the actual data is by actively measuring it, the easiest open-source tool out there to do this programmatically is Todd.

What could go wrong?

Assessing health-state is already a pretty difficult problem. It would be great if we had a set of simple metrics to assert connectivity, but if that was trivial half of us network engineers wouldn’t have jobs. For example, although a ping test failure necessarily means you did something wrong, ping success doesn’t suffice to say a change went successfully. Basically, we either don’t have enough information to assess the state properly or we have so much info that assessing state is hard. I’m unaware of a solution to handle too much info, but I feel like this would be a good use case for machine learning. That’s all to say that the mechanism chosen to assess health state may likely not suffice.

The second thing is that even if the mechanisms to assess state you have do suffice, imagine your change next state is incompatible with your previous state, for example, you are changing your BGP password. In that case, your change intermediate steps do not present full connectivity. Canarying doesn’t make much sense in those scenarios. This scenario comes more often than you would wish since a lot of network changes exist to fix something.

Another challenge is that sometimes you just can’t replicate the current state of production in your development environment, that way you can’t really develop a procedure that executes a change in zero downtime. Imagine for example, you developed a change procedure that works in your development environment but when you push the change to the first subset of switches, a failure in redundancy is detected, and you abort the change. This reduces the throughput of changes executed by your team. There’s a point where the risk-acceptance level of the change may need to be reclassified in order for work to be done.

How do I profit from this?

Canarying gives you the opportunity to identify a bug before compromising your whole network. And it reduces detection time as verification is now an automated procedure. Let’s for example, you pushed a configuration change with a broken route-map for example, invalidating some routes to your systems. A good detection system plus a blue/green type of deployment would contain the outage caused by misconfiguration.

At the end of the day, I believe, what determines the productivity of your team is how fast you can find issues. By adopting test-driven practices you reduce your detection time, and thus reduce idle time of your team, improving productivity.

Leave a Comment

Network automation with Ansible : Canarying / Rolling upgrades

In this post, I describe my experience at the NANOG 72 Hackathon and explain the project I worked on. If you want to see the work, my diffs can be found here.

The Hackathon lasted 8 hours and it involved engineers of all levels. It started with a presentation on network automation tools. Followed by team-forming: anyone with an idea shouted it out to the group and then teams were self-organized. I shared an idea for canarying automated network changes. Let me explain.

A typical challenge on network management is rolling out changes fast and reliably. Infra-as-code already goes a long way removing the human element from the equation, if you have no clue about what I’m talking about check this video. Yet, your automation has the potential to cause outages if a bug slips through testing. A good principle for automation is canarying. It consists of performing changes on a subset of endpoints and verifying the health state of the system before proceeding to prevent the wide-scale spread of a mistake.

Examples of things that may be canaried are patches, OS updates, critical software updates, config changes and etc. When using the good’ole CLI one always checks the state of the system to see if the changes look good. Canarying is analogous to that. Say you need to change the software running on all your switches from quagga to FRR. Wouldn’t it be great if you could perform those changes fast while still making sure your network is working perfectly? Yes! The alternative to that is running your scripts like a savage only to realize later that a typo slipped through your code review and blackholed all your datacenter traffic.

Now, back to the Hackathon. I convinced my team to leverage a vagrant environment + ansible code open-sourced by Cumulus. Leveraging open-source material was a great way to bootstrap development and get to a baseline faster, then we could focus on the canarying solution (that may have been a mistake). It turns out the internet was saturated and it took us more than an hour to download the boxes. At noon, I was able to bring up the environment only to find out that those boxes no longer supported quagga. That brought us to around 1PM and my team was getting a little impatient. At that time, folks were discussing pivot options but I decided to finish the work by myself. So I deserted my team, or they deserted me, you choose.

Anyway, I changed the ansible scripts to run FRR and finally had a running topology around 2PM. After that, I started playing with ansible and quickly found the feature necessary for my use case. Ansible allows you to configure the number of endpoints it runs against with the field “serial”. Once you set serial to 1 the scripts will run one at a time. DONE!!! RIGHT? Not yet.

Now it became interesting, and I grabbed a couple people to discuss how to actually implement this. And basically, the discussion ran around defining what is sufficient condition to accurately determine the state of the system.

  1. Ping. Although a failed ping implies network failure, its success doesn’t mean there are no problems changes.
  2. Route table of the modified switch: That doesn’t guarantee the whole system is in a positive state. For example, things could look good on a switch but a route could have been withdrawn on the other side of the network.
  3. Global routing table state. That one can only be right, the challenge is how can you get that info.
  4. Some folks in the team mentioned normally they have monitoring systems running to detect anomalies and remediate them with scripts. But you don’t know what you don’t know. So I’d advocate for canarying additionally to that.

Okay, so I quickly did #2 and realized it wasn’t good enough. I should have stopped coding there and made a powerpoint, but I decided to keep hacking instead. I wasn’t able to complete #3 and kinda just mumbled the content of this post. It was cool. Overall, it made my Sunday productive and I wouldn’t have done anything like this otherwise.

I finished this project a few weeks later. I wrote a flask web service that returns the number of working BGP neighbors, then on Ansible I can call that API and assess the global state. Let’s go for a tutorial.

Canarying tutorial

To run this you need vagrant 2.02. To start bring up the infrastructure:

 git clone https://github.com/cumulusnetworks/cldemo-vagrant
 cd cldemo-vagrant
 sudo vagrant up oob-mgmt-server oob-mgmt-switch leaf01
 sudo vagrant up leaf02 leaf03 leaf04 spine01 spine02 

This should bring up a leaf-spine infrastructure not yet configured. To configure it do the following:

 sudo vagrant ssh oob-mgmt-server
git clone https://github.com/castroflavio/cldemo-roh-ansible
cd cldemo-roh-ansible
ansible-playbook start.yml

The next step is to run the change.yml playbook:

---
- hosts: spines
  user: cumulus
  become: yes
  become_method: sudo
  roles:
    - ifupdown2
    - frr
    - statecheck
  serial: 1
  max_fail_percentage: 50

The magic lies on the serial field, which stipulates changes need to be deployed sequentially, 1 node at a time in this case. Whenever a change fails the statecheck playbook will fail:

- uri:
    url: "http://{{ item }}:5000/"
    return_content: yes
  register: webpage
  with_items:    
    - '192.168.0.11'
    - '192.168.0.12'
    - '192.168.0.13'
    - '192.168.0.14'

- debug: var=item.content
  failed_when: item.content|int < 2
  with_items: "{{ webpage.results }}"

It reaches out to every leaf(192.168.0.1*) and gets the number of BGP neighbors through a REST API. The Web service code can be found here.

Thanks for reading the long post, do not hesitate to share any questions and thoughts.

Leave a Comment

DevOps essentials: Developer Environment

“90% of coding is debugging, the other 10% is writing bugs.”

If you develop any code you know how true this is. This implies the speed you correct bugs is what really dictates your feature release velocity. This relates to a critical part of DevOps: CI/CD. Continues Integration allows bugs to be found faster, continuous deployment allows fixes to be released in production faster.

In this post, I talk about the importance of a stable Developer Environment (Dev Env) and present a short tutorial on how to set up a virtual routing environment with open source tools provided by Cumulus.

Why bother at all?

A DevEnv to test your automation scripts is essential for any effective development team. It allows devs to test their code in minutes rather than days independently of others, increasing their velocity drastically. It also improves collaboration, by making sure all devs are starting from the same stable point.

Here is an example of how bad this is: Company ABC only has one testing environment in which it performs all testing. Say a good scheduling process allows for 50% utilization, and each dev takes 1 hour to run a script and verify its outcome and an additional hour to clean-up the environment. A work day has 8 hours, where 4 hours are utilized, and thus only 2 tests can be performed per day. In this case, no matter how big your team is, you can only push a total of 2 features or fixes per day. This is pretty much a fixed cap on the team productivity.

Technology choices

I’ve been wanting to set up a virtual environment for a while. At first, I tried using Mininet, while it suffices for routing using quagga, it required too much work to set it up in a way I could use it for testing scripts. The other options were eve-ng(uNetLab), GNS3 and vagrant. I crossed GNS3 right away because the overhead and learning curve are significant. If I had to run IOS I’d go for eve-ng, but I don’t. Additionally, the learning curve for vagrant was shorter thus it’s useful to more people.

Kudos to Cumulus for open-sourcing this, it is great to see vendors contributing multi-purpose code rather than just taking code from others or promoting their own technologies and I urge you to check their work. You can start from here.

Quick start

Disclaimer: this code is available at the cumulus GitHub. Before running this demo, install VirtualBox and Vagrant.

### Bring up the vagrant topology
git clone https://github.com/cumulusnetworks/cldemo-vagrant
cd cldemo-vagrant
vagrant up oob-mgmt-server oob-mgmt-switch leaf01 leaf02 spine01 spine02 server01 server02

### setup oob mgmt server
vagrant ssh oob-mgmt-server

### Run the ROH demo
git clone https://github.com/cumulusnetworks/cldemo-roh-ansible
cd cldemo-roh-ansible
ansible-playbook run-demo.yml

### check reachability of server02 from server01
ssh server01
wget 10.0.0.32
cat index.html

Custom topology

You only need vagrant, Virtualbox and git to run this tutorial. Vagrant is really simple, once you have a vagrantFile, you need exactly one line of code to bring your environment up. The tricky part is to build the Vagrant File, Cumulus not only provides the templates but also a tool to create the file from a topology file. It’s the topology converter.

cldemo_topology

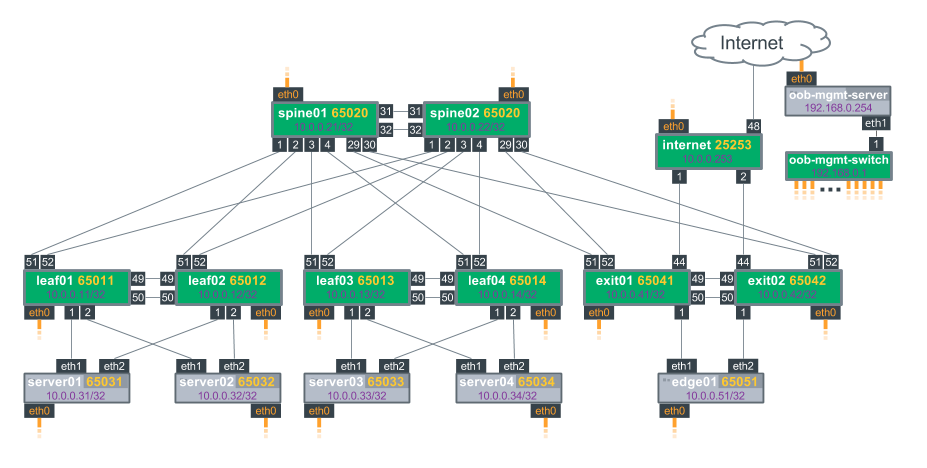
The figure above shows the default topology, you can change it by editing the topology file and then run the topology_converter again:

python topology_converter.py topology.dot

After that simply do. Vagrant up and boom.

vagrant up
vagrant ssh oob-mgmt-server

Conclusion

In this post, I talked about the importance of a stable developer environment and how that fits into the DevOps framework. I also gave an example of how to establish an environment.

This links back to the SDN value proposition: the ability to run software processes to improve your infrastructure. But, people have virtualized network devices for years, there’s nothing new there. True, still, a significant part of network operators does not have a virtual environment in order to test their systems. On the other side, with the rise of OpenVSwitch and creation of Mininet, SDN developers started using network emulation to develop SDN systems and have always taken this as a given yielding increased development agility.

This also leads me to some thoughts on how P4 can improve enterprise systems, but I’ll leave that for a future post. Again, please let me know your thoughts on this

1 Comment